Just finished the digital tracer project uTracer V3. Did some further tests this morning, now with my favourite DHT: 4P1L.
Started with a well known bias point for triode-strapped operation:
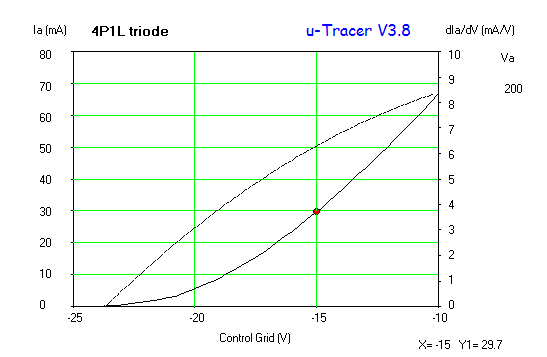 Nice to see the valve biasing at 30mA/-15V for an anode voltage of 200V
Transconductance is slightly above 6mA/V which is spot on. Looking at the anode curves we can see is really linear. BTW: no average on the samples taken:
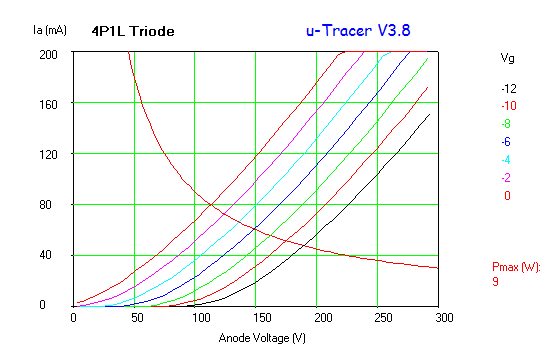
Then I took the A2 grid and anode curves using the screen connection. Started at 2V which is the lowest possible:

When combined both graphs in Excel I realised that there was a 2V shift in the A2 curves. Is this expected in uTracer? I corrected the grid voltage by adding +2V to the measured voltage using the screen measurement circuit:

Clearly the grid current raises significantly at very low voltages showing the very low impedance in A2. Not sure whether the curve extreme bunching is correct or is the performance of the screen driver.
Looking at matching the SPICE model, I couldn’t fit easily the positive curves:

Then tried to create a more accurate model for the grid current:

Need to better match this, but as a first attempt is not that bad.Here is the generated SPICE model:
**** 4P1L A2 TRIODE ** Composite DHT with Advanced Grid Current **************
* Created on 09/22/2013 10:18 using paint_kit.jar Version 2.4 Beta. May 2013
* www.bartola.co.uk/valves
* Traced by Ale Moglia using uTracer v3
* Plate Curves image file: 4P1L A2 TRIODE
* Plate Data source link: www.bartola.co.uk/valves
*----------------------------------------------------------------------------------
.SUBCKT DHT_4P1L_A2 1 2 3 4 ; P G K1 K2
+ PARAMS: CCG=6P CGP=8P CCP=4P RFIL=1.62
+ MU=9.6 KG1=851 KP=52 KVB=144.4 VCT=0.444 EX=1.41
+ VGOFF=-0.6 IGA=0.001 IGB=0.3 IGC=8 IGEX=2
* Vp_MAX=250 Ip_MAX=100 Vg_step=2 Vg_start=16 Vg_count=15
* Rp=4000 Vg_ac=55 P_max=9 Vg_qui=-48
* X_MIN=120 Y_MIN=68 X_SIZE=561 Y_SIZE=500 FSZ_X=1340 FSZ_Y=661 XYGrid=false
*----------------------------------------------------------------------------------
RFIL_LEFT 3 31 {RFIL/4}
RFIL_RIGHT 4 41 {RFIL/4}
RFIL_MIDDLE1 31 34 {RFIL/4}
RFIL_MIDDLE2 34 41 {RFIL/4}
E11 32 0 VALUE={V(1,31)/KP*LOG(1+EXP(KP*(1/MU+V(2,31)/SQRT(KVB+V(1,31)*V(1,31)))))}
E12 42 0 VALUE={V(1,41)/KP*LOG(1+EXP(KP*(1/MU+V(2,41)/SQRT(KVB+V(1,41)*V(1,41)))))}
RE11 34 0 1G
G11 1 31 VALUE={(PWR(V(32),EX)+PWRS(V(32),EX))/(2*KG1)}
G12 1 41 VALUE={(PWR(V(42),EX)+PWRS(V(42),EX))/(2*KG1)}
RCP1 1 34 1G
C1 2 34 {CCG} ; CATHODE-GRID
C2 2 1 {CGP} ; GRID=PLATE
C3 1 34 {CCP} ; CATHODE-PLATE
RE2 2 0 1G
EGC1 81 0 VALUE={V(2,31)-VGOFF} ; POSITIVE GRID THRESHOLD
GG1 2 31 VALUE={0.5*(IGA+IGB/(IGC+V(1,31)))*(MU/KG1)*(PWR(V(81),IGEX)+PWRS(V(81),IGEX))}
EGC2 82 0 VALUE={V(2,41)-VGOFF} ; POSITIVE GRID THRESHOLD
GG2 2 41 VALUE={0.5*(IGA+IGB/(IGC+V(1,41)))*(MU/KG1)*(PWR(V(82),IGEX)+PWRS(V(82),IGEX))}
.ENDS
*$
Just need to further investigate this…
Cheers,
Ale
Ale, this is a very interesting research!
These are your tubes mate! thanks!!
I turned out that I was using the uTracer in the wrong way. I hope to upload an updated model soon…
🙂 Ale, forward to continuing…