
The 6e5p is high-frequency indirectly-heated tetrode from our friends in Russia. The specifications can be found here. Anode can easily dissipate 8W and screen can take up to 2W and has a high transconductance of around 30 mA/V
Wired as triode this chap becomes very attractive. The anode resistance drops to around 900Ω – 1KΩ and effective mu is about 30-35. This turns this valve into a low anode, medium mu and high transconductance fellow which is highly regarded as a driver in SE amplifiers. Check out there in the jungle and you will find many good examples of how this valve is being used effectively.
When testing this valve on my curve tracer I found that it probes to be a challenging device. You need to leave this guy running on its own for a while (Lars recommended 30 min to 1 hour). I found that indeed after 20-30 min it stabilise.

Dmitry came up with a very good model. When I created a model based on my curves found a mismatch between my notes and simulation. Checking my notes I think I set up the tester to start plotting curves at 0V with a step of -0.5V, however looking at the model produced by Dmitry’s tool, I got this:

It looks like the curves starts at -2V. Need to re-check and probably trace this valve again. Either way it does match very well and not far off from Dmitry’s model from above.
Here is my model.
I’m planning to use this valve in my OTL (cap-less) headphone amp. Stay tuned…
A question of bias
When I asked Dmitry what could be the root cause of the bias difference found in the model above, I got the following explanation of VCT parameter:
So Dmitry’s suggestion was:
“So VCT is nothing but an offset on grid voltage in the formulas, so for 2 identical curve sets differing only with VCT by, say, 2V, it can be shown that the curve sets will align but with 2V grid difference..
So in your case to force the first traced curve to align with the first in the set, have VCT=-2.88.
You can type the above in the parameter box in the tool and hit return. Done!
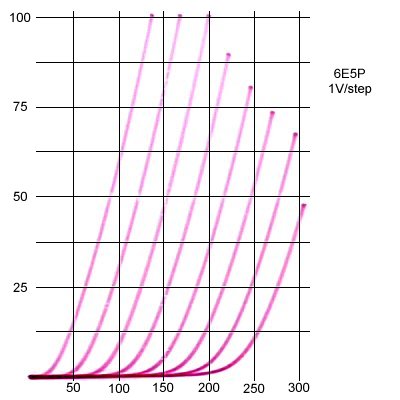
Now, why on earth so much VCT is needed? That I do not know.. When I matched Hagerman’s curves,http://www.hagtech.com/blog/images/6e5p.jpg, I found
VCT=-0.39
to do the trick and it is a very reasonable contact potential-induced value…. whereas -2.88 is not. So it does look to me that there is some evil offset on the grid in your tracer sneaking in, causing it to show curves starting with some seriously negatove grid voltage (-2.5V or so to be exact), not zero……. or if there is some zero calibr issue with your measurements – could there be something causing as much as 25V (one div) offset alone X????? I know the later sounds rather impossible but it is worth checking what’s going on.
P.S. Note that if one looks close at the Hagerman’s jpg, there is no vertical axis so one has to wonder where it is is. Depending on where it is, one can find VCT=-0.42 to -0.44 to be maybe more appropriate than -0.39, but this is fine-tuning!”
Well, it was definitely a bias issue. Playing with VCT I matched the curves easily:

Then Dmitry looked at the model again to improve matching:
“Here is a snapshot of a pretty much dead-spot ideal 100% accurate match over Hagerman’s curves I did yesterday: I restored the Y axis position on Hagerman’s plot by editing the image in Paint (pasted a square over the lower region and realigned the curves and changed VCT to about -0.5 and very very slightly KG1, Mu and KP”

I then looked at using Dmitry’s model to match my plot. I had to adjust mu and VCT at least, as the valves were clearly not the same ones

Not too bad at all. Had only to adjusting mu and EX in addition to the VCT difference caused by the bias issue…
Penny dropped finally so I checked my OWON digital oscilloscope which I use to set grid zero and step. Found that there was a bias offset of about 0.35V
When readjusted the offset to ensure bias and first curve was definitely at 0V, I managed to get the following results:

Well, bottom line is that all my previous traced curves are somewhere shifted by 0.3V 🙂 Not a big thing in medium-mu or power valves, but do bare in mind if you looked at my published curves for 6C45, etc.
Been testing many of these so far at Ia=30mA and Vg=-2V. Transconductance is about 30,000 umhos at this point. Will use this as a testing reference since all my 6e5P are NOS.